
You've sat through three demos this quarter. Three dashboards, three confident return on ad spend (ROAS) figures, and three vendors who each say their number is the accurate one. The numbers don't match each other, and none of them match what finance sees in the sales system. Each vendor walked you through a polished interface, sample data, and a few customer logos. By the end, you were comparing screenshots, not answers.
That's a hard spot for a marketing leader who's been asked to prove what ad spend returns. It's also an expensive one. Gartner found that utilization of marketing technology stacks "dropped to just 33% on average in 2023," down from 58% in 2020 [1]. Buying another tool nobody trusts is a real risk.
This marketing analytics buyer's guide offers a different way to compare vendors. Instead of comparing feature lists, ask the questions that show how each vendor's number is made. They work with any vendor, including us. Most take less than a minute to ask, and the answers tell you more than any feature checklist.
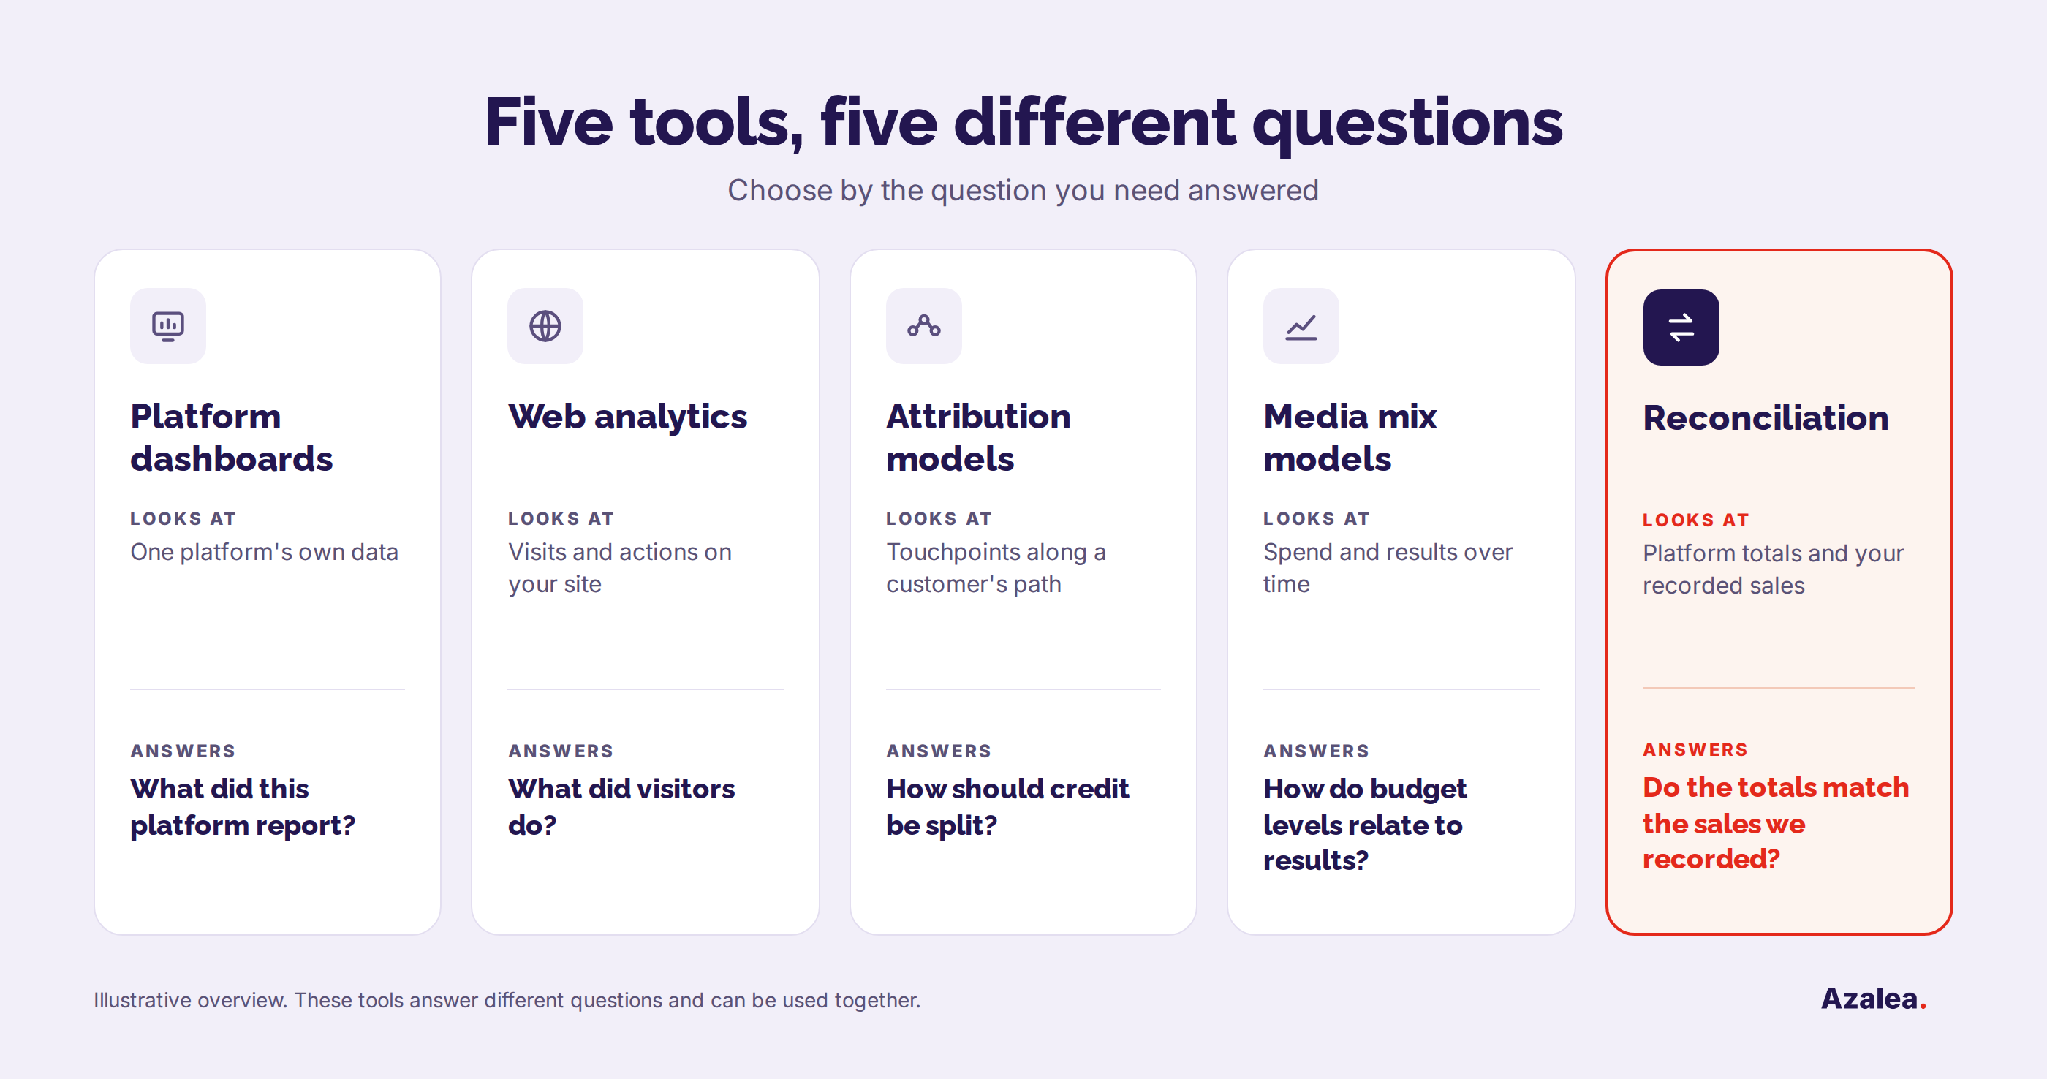
"Marketing analytics" is a broad label. Most tools fall into five types, and each one answers a different question.
Here's a quick way to use this list. Before your next demo, write down the one question your CFO or CEO keeps asking. If it's "what did visitors do?" you need web analytics. If it's "does our ad spend tie to the sales we recorded?" you need reconciliation.
Our first two articles go deeper: why platform-reported ROAS differs from true ROAS, and how attribution and reconciliation answer different questions.
The short version is that these tools aren't rivals. Many teams use two or three together. A marketing attribution software comparison only makes sense once you know which question you need answered.
Eight questions to ask analytics vendors
Every vendor will show you a clean dashboard. These eight questions show what's underneath it. Each comes with the exact wording to use in the demo.
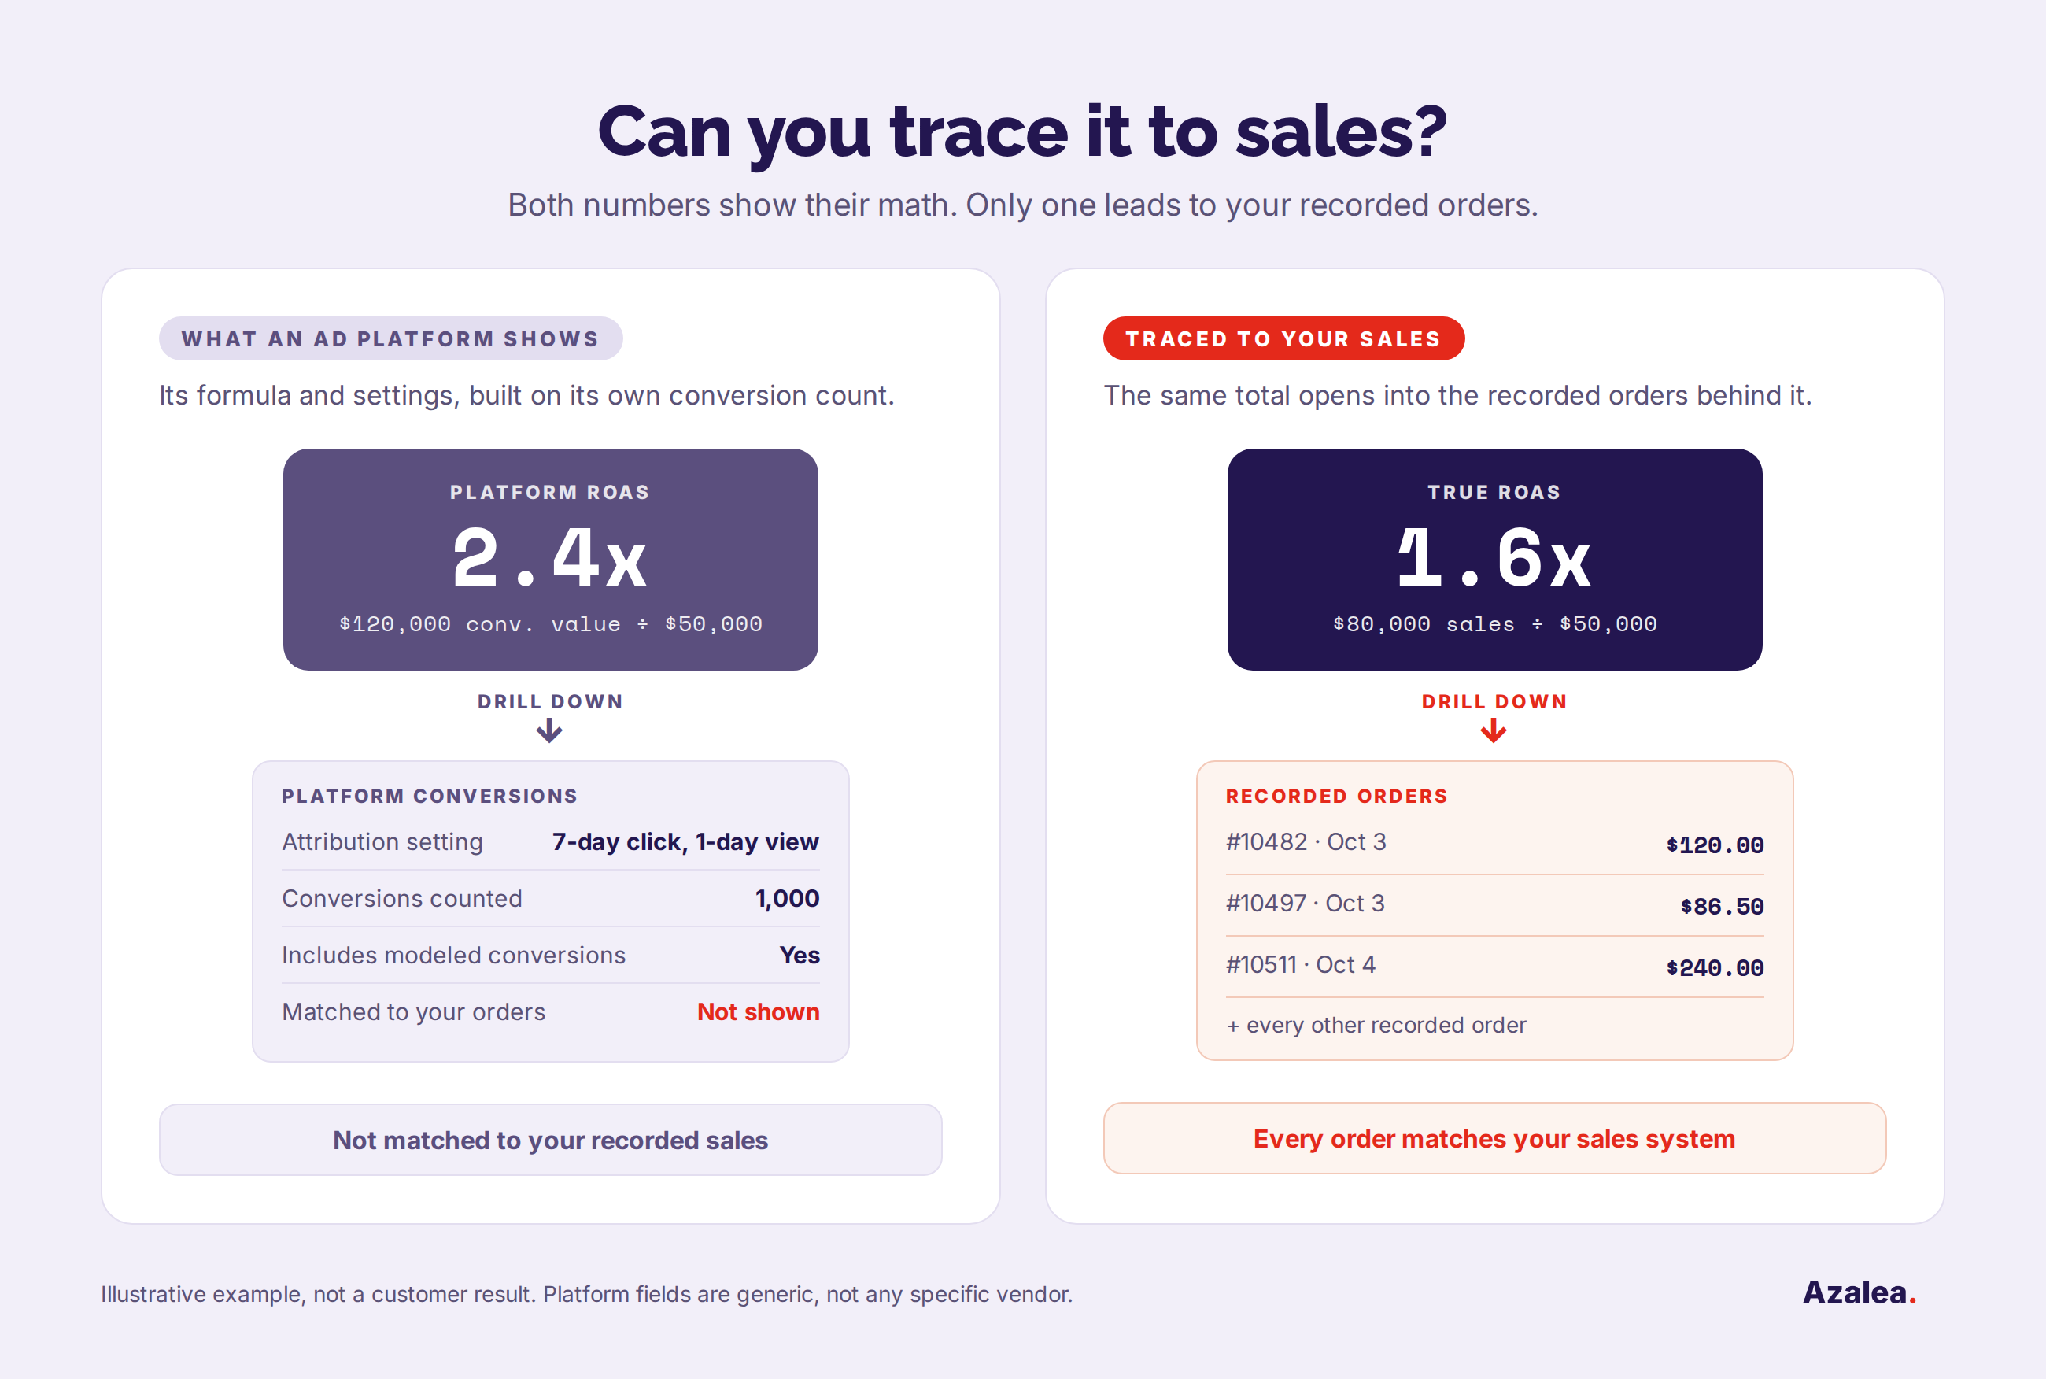
1. Where does the revenue number come from? Some tools report the revenue the ad platforms credit to themselves. Others start from the sales your business actually recorded. Both are legitimate, but they're different numbers, and only one ties to your books. Revenue from your own sales system is what gives you true ROAS. Platform-credited revenue follows each platform's own rules. Meta's help center, for example, explains that purchases are credited to an ad "if they happened within a certain number of days after someone viewed or clicked on your ad" [5].
Ask: "Is this revenue from our sales system, or from the platforms' reports?"
2. Can you drill from the total to the orders behind it? A total you can't open is a total you have to take on faith. Revenue-connected marketing analytics should let you click from a campaign's revenue down to the individual orders or closed deals behind it. Without that drill-down, every disagreement with finance turns into a debate about whose system to believe.
Ask: "Show me the orders behind this number."
3. Can you explain the method to your CFO in two minutes? Some methods are simple rules. Others are statistical models. Google's data-driven attribution, for example, estimates credit by "comparing the paths of customers who convert to the paths of customers who don't" [6]. Models can be useful, but you should be able to say what goes in and what comes out. Look for visible rules and no black-box modeling. If the vendor can't explain it to you, you won't be able to explain it to finance.
Ask: "Walk me through how one sale gets assigned to a campaign."
4. Which sources does it connect? Online orders are only part of revenue for many businesses. Google notes that an ad often "starts a customer down a path" that ends in a sale made offline [7]. Retail stores, wholesale, marketplaces, and deals closed by a sales team may all matter. A tool that only sees web orders will understate channels that drive sales elsewhere.
Ask: "Which of our sales systems can you connect, including offline and marketplace sales?"
5. How does it handle a sale that several platforms claim? Each platform counts conversions (the sales or sign-ups it credits to its ads) by its own rules. Meta, for example, lets advertisers count conversions "within 1-day or 7-day after a link click" or "within 1-day after an impression" [8]. When two platforms' windows both cover the same customer, both can report the sale. That's how they count, not an error, but your tool should resolve it rather than add both claims to the total. One reliable approach is to give every campaign its own unique tag, such as a tracking code in its links, so each recorded order can be tied to the campaign tag it carries and counted once.
Ask: "If two platforms claim the same order, how do you tie it to the right campaign?"
6. How long until the first usable answer? Some methods need time or volume before they're reliable. Google recommends "at least 200 conversions and 2,000 ad interactions" within 30 days for data-driven attribution [6]. Other approaches need months of history or a long setup project. Ask, too, how often the numbers refresh once you're live: daily, weekly, or monthly.
Ask: "When will we see our first usable answer, and what do you need from us to get there?"
7. Who owns the data, and can you export it? Your sales and ad data should stay yours. In the EU, GDPR requires contracts with data processors (vendors that handle personal data for you) to cover what happens when the service ends: the processor "deletes or returns all the personal data to the controller," at your choice as the controller [9]. Wherever you operate, ask the same question, and ask whether the vendor uses your data for anything beyond serving your account.
Ask: "Can we export everything, in what format, and what happens to our data if we leave?"
8. What do pricing, onboarding, and support look like after signing? Onboarding is where many tools stall. Find out who does the integration work, what support looks like after launch, and how pricing changes as your data grows. Ask who you'll call when a number looks wrong, and how quickly they respond.
Ask: "Who on your side owns our setup, and what does month three look like?"
Some answers deserve a follow-up question. None of these means a vendor is wrong, but each is worth probing before you sign.
A good marketing analytics software evaluation is mostly discipline. Four habits make the comparison fair.
Meta's own documentation makes a point that applies here. Comparing results across different attribution models "will lead to inaccurate conclusions" [8]. The same is true of vendors. Compare like with like, on the same data, against the same questions. When the evaluation ends, score each vendor against the requirements you wrote down, not against the demo you remember best.
The best marketing analytics tool isn't the one with the most features. It's the one whose number you can trace to your recorded sales and defend in front of your CFO. A tool that can answer all eight questions clearly is worth your time, whoever makes it.
Take the checklist below into every demo, including ours. If Azalea can't answer these questions clearly, we're not the right fit. If we can, let us show you on your own data. Then let your marketing bloom.
About the Author
Karrington Ogans is a Project Manager at Azalea, specializing in the deployment of AI-driven tools and advanced technical workflows. She holds a B.A. in applied mathematical sciences from Gonzaga University and a certificate in AI prompt engineering. Throughout her career, Karrington has driven technical execution from the ground up: at the Fred Hutchinson Cancer Center, she assisted in engineering real-time object detection models and augmented reality tools for lab research, while at LabLight AR, she built custom LLM-powered AI agents to automate scientific workflows. Backed by deep hands-on experience, she focuses on managing custom datasets and presenting live technical demonstrations to audiences ranging from bench scientists to cross-functional stakeholders.